By Andy May
We've all heard this question before. We point out that there is no evidence that current climate changes, whether man-made or natural, are dangerous or unusual. Then we're asked, “What about sea level rise? Isn't that dangerous?” There are many very good technical arguments why the current rate of sea level rise will not threaten humanity, New York City, Miami, or Tuvalu. These are urban legends spawned by silly IPCC models, as Ole Humlum explains in Chapter 10 of our latest book (Crok & May, 2023). How can these myths be debunked quickly and in clear language? This is my best attempt in ~600 words. Let me know how I did.
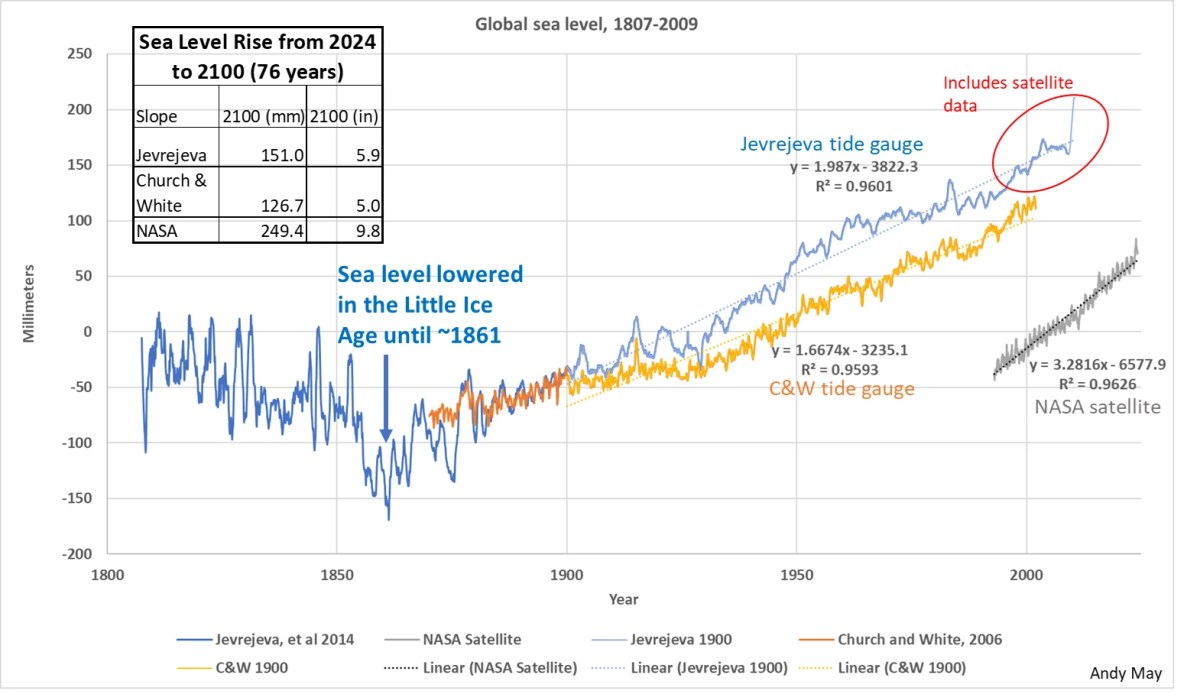
The current rate of global sea level rise is below the accuracy of our current measurement capabilities, as discussed in Chapter 5 by Kip Hansen in Crok & May. Figure 1 shows three accepted estimates. Sea levels are shown as reported and have different zero points. The estimate by Jevrejeva et al. in blue is 2 mm/yr (± ~0.3), the estimate below is that of Church and White at 1.7 (± ~0.3) mm/yr. These estimates are both based on tide gauges, although Jevrejeva's estimate attempts to incorporate satellite data from 1993 to 2009. Due to the overlap in the author's uncertainty estimates, the two estimates are statistically equivalent.
Figure 1. Three accepted estimates of the rate of sea level rise in mm/year. Sources: (Jevrejeva, Moore, Grinsted, Matthews, & Spada, 2014), (Church & White, 2006), and (Beckley, Callahan, Hancock, Mitchum, & Ray, 2017). Jevrejeva, 2014, discusses their reconstruction only up to 2009, so they do not take into account the sudden rise in 2010 shown in their dataset.
The lower estimate, shown in gray, uses all NASA satellite data since 1993. It shows a rate of 3.3 mm/year (Beckley, Callahan, Hancock, Mitchum, & Ray, 2017). The satellite records are too short to be meaningful. We need at least another 60 years of data before we can derive a meaningful rate from satellite data. The satellite data cover only the upstream part of an approximately 60-year cycle or oscillation that began in 1991.
Global mean sea level has been rising over the past 170 years, but in cyclical intervals. The cycle is clearly visible in Figure 1 from about 1930 to 1991 in the reconstruction by Jevrejeva et al. It is also visible, albeit in a weaker form, in the reconstruction by Church and White. Therefore, any estimate of the rate of rise based on a reconstruction (satellite, tide gauge, or combined) shorter than 90-120 years is incorrect. Sea level fell during the Little Ice Age until it began to rise again in about 1861.
All values (since 1900) are projected to 2100 in the upper left box, showing sea level rises of between 5 and 10 inches by 2100. These rises are much smaller than the average daily tidal range of over a meter. Such a small rise in 76 years is unlikely to be noticed. It is important to note here that sea level is not the same in all oceans, as one might expect. In Panama, sea level on the Pacific side of the country is 20 cm (~8 inches) higher than on the Atlantic/Caribbean side. This is roughly equivalent to the global sea level rise expected between now and 2100. More importantly, the tidal range is much greater on the Pacific side than on the Caribbean side.
Measuring global mean sea level is made extremely difficult by ocean-to-ocean variations in mean sea level and the associated changes in daily tidal range. Jevrejeva points out that tide gauges are confined to continental and island margins, most of which are in the Northern Hemisphere, that tide gauge records do not all cover the same time period, and that they are tied to land, which itself sometimes rises and falls. Jevrejeva points out that it is not easy to combine the various records into a single global sea level curve.
Similarly, any estimate of the acceleration of the rate using any of these data or any combination of them is little more than a guess. Polynomial fits to any of these series may show some acceleration, but the fit to the polynomials is not statistically different from a linear fit to the same data.
As many of my regular readers know, I often put ideas up for debate. I want to know what the best arguments are against my ideas. Or have I missed a better argument? So, whether positive or negative, give me your best. Am I right or wrong? Is there a better argument than the one I've offered?
Beckley, BD, Callahan, PS, Hancock, DW, Mitchum, GT, & Ray, RD (2017). On the “Cal-mode” correction of TOPEX satellite altimetry and its impact on the global mean sea level time series. Journal of Geophysical Research: Oceans, 122, 8371–8384. doi:10.1002/2017JC013090
Church, JA, & White, NJ (2006). An acceleration of global sea level rise during the 20th century. Geophys. Res. Lett., 33. doi:10.1029/2005GL024826
Crok, M., & May, A. (2023). The IPCC's frozen climate views, an analysis of AR6. Andy May Petrophysicist LLC.
Jevrejeva, Moore, J., Grinsted, A., Matthews, A., & Spada, G. (2014). Trends and acceleration in global and regional sea level rise since 1807. Global and Planetary Change, 113, 11-22. doi:10.1016/j.gloplacha.2013.12.004
Like this:
Is loading…