
From Dr. Roy Spencer's Global Warming Blog
by Roy W. Spencer, Ph.D.
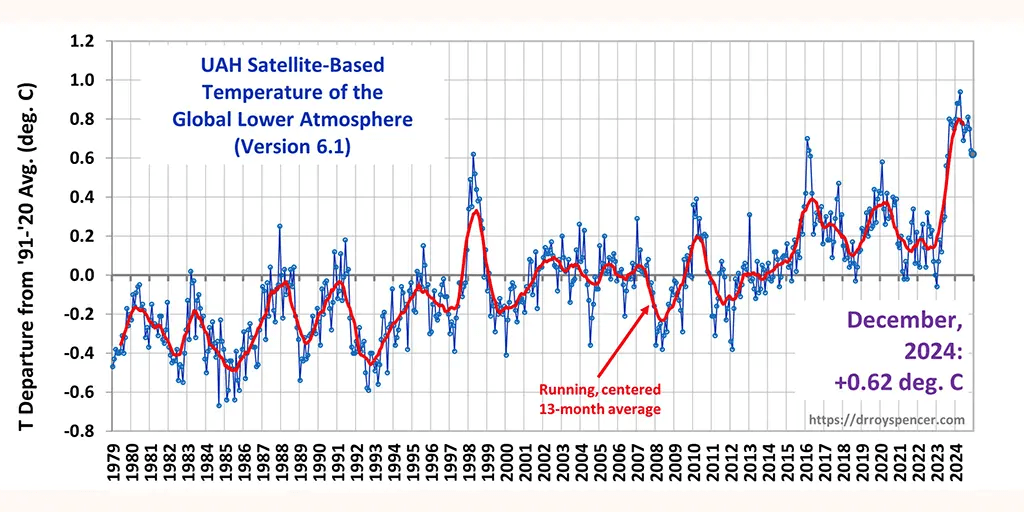
2024 sets new record for warmest year in satellite era (since 1979)
The global average lower troposphere (LT) temperature anomaly in version 6.1 for December 2024 was +0.62 degrees. C deviation from the 1991-2020 mean, slightly smaller than the November 2024 anomaly of +0.64 degrees.
The global area-averaged temperature trend (January 1979 to December 2024) of version 6.1 remains at +0.15 °C/decade (+0.22 °C/decade over land, +0.13 °C/decade over oceans).
As shown in the following ranking of years from warmest to coldest, 2024 was by far the warmest in the 46-year satellite record, with an average of 0.77 degrees. The temperature was above the 30-year average, while the second warmest year (2023) was +0.43 °C. C above the 30-year average. [Note: These yearly average anomalies weight the individual monthly anomalies by the number of days in each month.]
The following table shows various regional deviations of version 6.1 LT from the 30-year average (1991-2020) over the last 24 months (record highs are shown in red).
| YEAR | MO | GLOBE | NHEM. | SHE. | TROPICAL | USA48 | ARCTIC | AUST |
| 2023 | Jan | -0.06 | +0.07 | -0.19 | -0.41 | +0.14 | -0.10 | -0.45 |
| 2023 | February | +0.07 | +0.13 | +0.01 | -0.13 | +0.64 | -0.26 | +0.11 |
| 2023 | Damage | +0.18 | +0.22 | +0.14 | -0.17 | -1.36 | +0.15 | +0.58 |
| 2023 | April | +0.12 | +0.04 | +0.20 | -0.09 | -0.40 | +0.47 | +0.41 |
| 2023 | May | +0.28 | +0.16 | +0.41 | +0.32 | +0.37 | +0.52 | +0.10 |
| 2023 | June | +0.30 | +0.33 | +0.28 | +0.51 | -0.55 | +0.29 | +0.20 |
| 2023 | July | +0.56 | +0.59 | +0.54 | +0.83 | +0.28 | +0.79 | +1.42 |
| 2023 | Aug | +0.61 | +0.77 | +0.45 | +0.78 | +0.71 | +1.49 | +1.30 |
| 2023 | Sept | +0.80 | +0.84 | +0.76 | +0.82 | +0.25 | +1.11 | +1.17 |
| 2023 | Oct | +0.79 | +0.85 | +0.72 | +0.85 | +0.83 | +0.81 | +0.57 |
| 2023 | November | +0.77 | +0.87 | +0.67 | +0.87 | +0.50 | +1.08 | +0.29 |
| 2023 | Dec | +0.75 | +0.92 | +0.57 | +1.01 | +1.22 | +0.31 | +0.70 |
| 2024 | Jan | +0.80 | +1.02 | +0.58 | +1.20 | -0.19 | +0.40 | +1.12 |
| 2024 | February | +0.88 | +0.95 | +0.81 | +1.17 | +1.31 | +0.86 | +1.16 |
| 2024 | Damage | +0.88 | +0.96 | +0.80 | +1.26 | +0.22 | +1.05 | +1.34 |
| 2024 | April | +0.94 | +1.12 | +0.77 | +1.15 | +0.86 | +0.88 | +0.54 |
| 2024 | May | +0.78 | +0.77 | +0.78 | +1.20 | +0.05 | +0.22 | +0.53 |
| 2024 | June | +0.69 | +0.78 | +0.60 | +0.85 | +1.37 | +0.64 | +0.91 |
| 2024 | July | +0.74 | +0.86 | +0.62 | +0.97 | +0.44 | +0.56 | -0.06 |
| 2024 | Aug | +0.76 | +0.82 | +0.70 | +0.75 | +0.41 | +0.88 | +1.75 |
| 2024 | Sept | +0.81 | +1.04 | +0.58 | +0.82 | +1.32 | +1.48 | +0.98 |
| 2024 | Oct | +0.75 | +0.89 | +0.61 | +0.64 | +1.90 | +0.81 | +1.09 |
| 2024 | November | +0.64 | +0.88 | +0.41 | +0.53 | +1.12 | +0.79 | +1.00 |
| 2024 | Dec | +0.62 | +0.76 | +0.48 | +0.53 | +1.42 | +1.12 | +1.54 |
The full UAH Global Temperature Report as well as the LT-Global Gridpoint anomaly image for December 2024 and a more detailed analysis from John Christy should be available here in the next few days.
The monthly anomalies for different regions for the four deep layers that we monitor from satellites will be available in the next few days at the following locations:
Lower troposphere
Middle troposphere
Tropopause
Lower stratosphere
Like this:
Load…
Related
Explore more from Watts Up With That?
Subscribe to receive the latest posts by email.
Comments are closed.