From Dr. Roy Spencer's Global Warming
Roy W. Spencer, Ph.D.
The recent record-breaking satellite-derived UAH lower troposphere temperatures can be compared to another combination of MSU/AMSU satellite channels, which help confirm the temperature trends of our “lower troposphere” (LT) channel combination.
The three channels we use for LT are MSU channels 2 (“MT”), 3 (“TP”) and 4 (“LS”) (AMSU channels 5, 7 and 9). The primary channel used is “MT” (MSU channel 2 or AMSU channel 5), which has the greatest weight:
LT = 1.538*MT – 0.548*TP + 0.01*LS
Here is a figure from our 2017 document on version 6 of our dataset showing the three main temperature measurement channels and how they are combined for the LT product:
However, we also experimented with a weighted average of MSU channels 3 (“TP”) and 4 (“LS”) (AMSU channels 7 and 9), which produces a mean core in the upper troposphere (which is almost insensitive to stratospheric cooling in the tropics, but somewhat sensitive to stratospheric cooling in the extratropical regions where the tropopause [the boundary between troposphere and stratosphere] is lower). This allows an independent verification of our synthesized LT channel, taking into account that one is centered in the lower troposphere and the other in the upper troposphere.
We noticed that last month (May 2024) had a record high global average temperature in the tropopause channel (AMSU channel 7), so I decided to investigate this. By combining channels 7 and 9 for a synthesized upper troposphere (UT) channel
UT = 1.35*TP – 0.35*LS
The resulting vertical weight profile in the atmosphere is the purple curve below:
This synthesized UT channel produces the following temperature anomalies:
Note that on average, the synthesized UT channel reached record heat values in February, then March, then April, and then May 2024.
In the tropics, records were broken in March and then in May, although not by much more… the 1997-98 El Niño produced upper troposphere warmth almost as strong as our most recent El Niño.
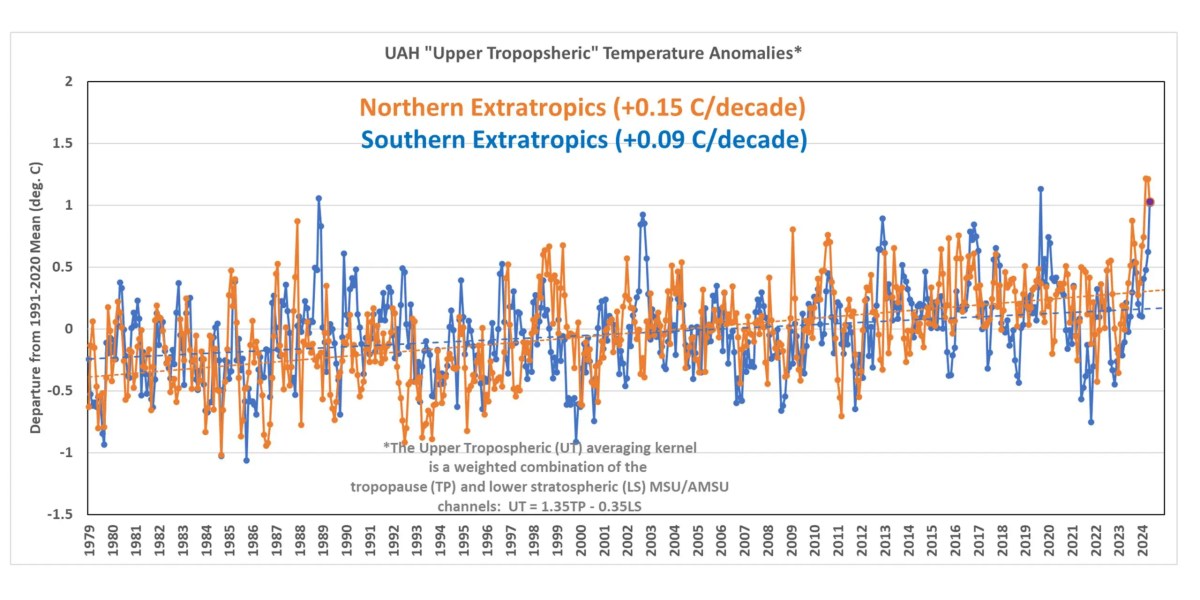
If we look only at the extratropical regions (next chart), we see that northern latitudes recorded record temperatures in March. However, in southern latitudes, May was only the third warmest, after September 2019 and November 1988.
Also note that the global UT trend is the same as the lower troposphere (LT) trend, which is +0.13 °C/decade. Since the global UT has some contamination from lower stratosphere cooling, the “true” UT value (if the stratospheric influence could be eliminated) would be somewhat warmer. By how much? I'm not sure… maybe +0.15 instead of +0.13 °C/decade as an educated guess.
In summary, I think this shows that our traditional LT (lower troposphere) temperature trends are essentially confirmed by the other channels of MSU/AMSU.
Remember that John Christy and I always compare these different trends on a level playing field with climate models: the barometric pressure data from the climate models are combined and weighted to obtain approximately the same weighting functions as the satellite data.
Like this:
Is loading…